User Experience
Early in GE Healthcare’s user interface consistency efforts, the GRD team partnered with GE to design a consistent user interface framework for several imaging products. Since then, we have continued to work with GE Healthcare on a range of devices and applications.
Radiology Workflow
Through observational research at hospitals and and radiology departments around the world, the GE and GRD teams developed a structure that guides users through complex diagnostic imaging procedures, improving productivity by making it easier for technologists to transfer from one system to the next. The resulting design was elegant, usable, and human, placing emphasis on patient care and attention.
The design brought the high-level workflow to the surface, displaying it down the left side of the screen. For CT, X-ray, Ultrasound, and MR, this high-level workflow is the same. The differences are found in the detailed levels.
The product interface was awarded the Gold Medal in the Industrial Design Society of America's (IDSA) IDEA 2000 Showcase: Digital Media Interfaces. Here's an excerpt:
“For software used in the post-processing of CT, MR and x-ray images for diagnosis or surgery, Volume Analysis has significantly increased ease of use and productivity by improving workflow and aesthetics. With other products, users faced inconsistency and a sharp learning curve, but here they laud the flexibility and simplicity. Models that took 10 steps now require three, and predefined steps ensure faster, more accurate diagnosis.“

“The highest compliment for an interface is that it makes something very complex seem easy, and that is just what this imaging interface does.”
- Gary Holland, IDSA, Frog
QuietCare Activity Monitoring
GE Healthcare asked us to help them re-design a product for tracking the activity of residents in assisted living. They wanted caregivers to be able to respond to events like falls or periods of inactivity, and to better understand how patient’s overall activity impacted their health. They also wanted to be able to view trends and dive into the data for each resident.
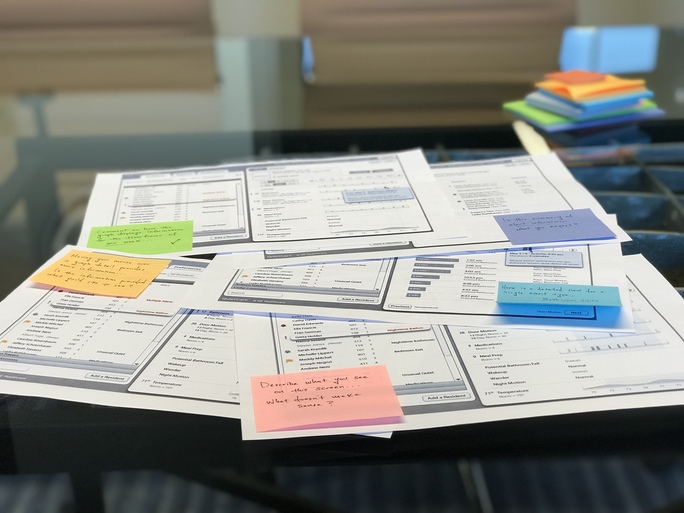

We designed a visualization dashboard for caregivers that allowed them to see all the residents at a glance and to get progressively more detail about a resident. The system presented information in a friendly way, to ease clinicians communication with patients and their families, who hoped to understand when daily events occurred.
Ambulatory ECG Analysis
We conducted extensive user research in hospitals and clinics to understand the current process and software for analyzing ambulatory ECG (Holter) data. We then analyzed the data to determine where improvements could be made. We helped GE Healthcare with the conceptual design for the new system.